In Command line type this
atomsInstall (" makematrix ")
Than go to -. scilab console->Application->Module manager -ATOMS->select Image Processing -> Install SIVP...
REF.
http://www.igpm.rwth-aachen.de/jarausch/NA_III/SciLab/introscilab_v1.7.pdf
http://scilab.in/files/workshops/29-11-2010-mumbai/Scilabtalk.pdf
http://scilab-imageprocessing.blogspot.com/2010_11_01_archive.html
http://www.comp.dit.ie/bmacnamee/materials/dip/labs/introtoscilab.pdf
http://atoms.scilab.org/categories/signal_processing
http://atoms.scilab.org/toolboxes/SIVP
Panoramic Picture Creation
This example illustrates simple method of panoramic picture
creation using sum of absolute differences. It assumes no zooming,
rotational variation in 2 images.
1. Reading Images for processing
1. Reading Images for processing
S1 = imread('p4-in1.jpg');
S2 = imread('p4-in2.jpg');
2. Showing Images1st Image
S2 = imread('p4-in2.jpg');
2. Showing Images1st Image
ShowColorImage(S1,'0');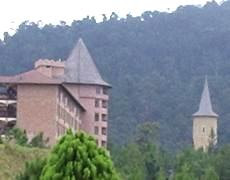
2nd Image
ShowColorImage(S2,'0');

3. Extract red layer of the image for processing using Sum of Absolute Differences (SAD)
S1r = S1(:,:,1);
S2r = S2(:,:,1);4. Sum of Absolute Differences (SAD) of a selected block is from each image are computed.
sz = 50;
roi2 = S2r(1:sz,1:sz);
[x,y]=size(S2r);
for cnt = y:-1:x/2
roi1 = S1r(1:sz,cnt-sz+1:cnt);
data(y-cnt+1)=sum(sum(abs(double(roi2)-double(roi1))));
end5. Finding minimum error among all comparison
plot(data);
[minval,ind] = min(data);
plot(ind,minval,'r*');

6. Combine the images at the minimum error region.
Sc = S1(1:$,1:y-sz-ind+1,:);
Sfinal = [Sc S2];7. Final ResultShowColorImage(Sfinal,'0');

Monday, November 15, 2010
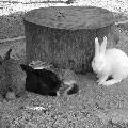
Detecting Object in an Image
1. How to detect an object in an image?
Determining
the features from the object that you want to detect is the key. The
feature in this case is something that differentiates the object from
others, such as color, shape, size, etc…
2. What are the techniques for object detection?
2. What are the techniques for object detection?
The
image processing techniques such as morphology or color processing
usually did this job. A simple example in Scilab of detecting ‘white
rabbit’ is shown as follow, in this case, ‘color’ is the feature used to
distinguish the white rabbit from other:

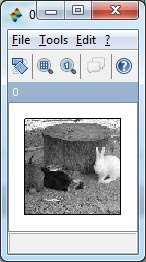
// Original Image
S = imread('p3-in1.jpg');
ShowColorImage(S,'0');

// Gray scale image
S2 = rgb2gray(S);
ShowImage(S2,'0');

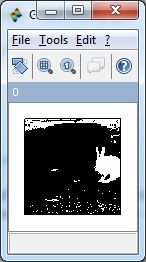
// Find the white color
S3 = S2>180;
ShowImage(S3,'0');
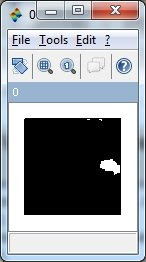
// Morphology technique, image erosion to erase the unwanted components
se = CreateStructureElement('vertical_line', 10);
S4 = ErodeImage(S3, se);
se = CreateStructureElement('horizontal_line', 10);
S4 = ErodeImage(S4, se);
ShowImage(S4,'0');
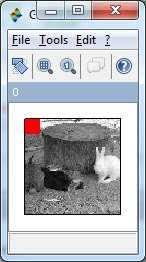
// Labeled the component(s), and plot the centroid on the original image

// Original Image
S = imread('p3-in1.jpg');
ShowColorImage(S,'0');

// Gray scale image
S2 = rgb2gray(S);
ShowImage(S2,'0');

// Find the white color
S3 = S2>180;
ShowImage(S3,'0');

// Morphology technique, image erosion to erase the unwanted components
se = CreateStructureElement('vertical_line', 10);
S4 = ErodeImage(S3, se);
se = CreateStructureElement('horizontal_line', 10);
S4 = ErodeImage(S4, se);
ShowImage(S4,'0');

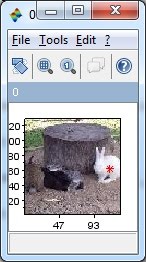
// Labeled the component(s), and plot the centroid on the original image
S5 = S4.*1;
IsCalculated = CreateFeatureStruct(%f); // Feature struct is generated.
IsCalculated.Centroid = %t; // The bounding box shall be calculated for each blob.
S6 = AnalyzeBlobs(S5, IsCalculated);
ShowColorImage(S,'0');
plot(S6(1).Centroid(1),S6(1).Centroid(2),'r*');

IsCalculated = CreateFeatureStruct(%f); // Feature struct is generated.
IsCalculated.Centroid = %t; // The bounding box shall be calculated for each blob.
S6 = AnalyzeBlobs(S5, IsCalculated);
ShowColorImage(S,'0');
plot(S6(1).Centroid(1),S6(1).Centroid(2),'r*');
Wednesday, November 10, 2010
Drawing Shapes by Overwriting Pixel Value
1. How to highlight certain portion on an image?
The basic concept of highlighting part of an image is “Overwriting Pixel Value” on the image. We start from the basic idea on how to mask portion of image with blank sub-image (black color sub-image). Figure below shows the image with the size of 128x128x3 in which 3 represents RGB. (In grayscale image 3 layers are the same). The second image at the right hand site shows a black sub-image is placed at the upper left of the original image. The Scilab code to perform the operation are as follow:
S = imread('p2-in1.jpg');
S2 = S;
S2(:,:,2) = S;
S2(:,:,3) = S; // Create a gray-scale RGB Image
S = S2; // Save a copy of image
ShowColorImage(S2,'0');
Sblack = uint8(zeros(20,20,3));
S2 = S;
S2(1:20,1:20,:) = Sblack;
ShowColorImage(S2,'0');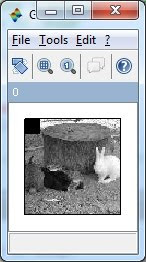
2. How to create a color mask rather than black color mask?
Since
the 3 layers of image matrix represent RGB layers of the image, we can
create the red color mask using following command, and the results are
shown as shown.
Sred = Sblack;
Sred(:,:,1)=255;
S2 = S;
S2(1:20,1:20,:) = Sred;
ShowColorImage(S2,'0');
Simple enough, just play with the values R value, and perform the image addition rather than overwriting the value as follow:
Sred = Sblack;
S2 = S;
S2(1:20,1:20,1) = 255;
ShowColorImage(S2,'0');


Note: To run example in this article, please follow the installation of Scilab and toolboxes at previous post.
The basic concept of highlighting part of an image is “Overwriting Pixel Value” on the image. We start from the basic idea on how to mask portion of image with blank sub-image (black color sub-image). Figure below shows the image with the size of 128x128x3 in which 3 represents RGB. (In grayscale image 3 layers are the same). The second image at the right hand site shows a black sub-image is placed at the upper left of the original image. The Scilab code to perform the operation are as follow:

S = imread('p2-in1.jpg');
S2 = S;
S2(:,:,2) = S;
S2(:,:,3) = S; // Create a gray-scale RGB Image
S = S2; // Save a copy of image
ShowColorImage(S2,'0');

Sblack = uint8(zeros(20,20,3));
S2 = S;
S2(1:20,1:20,:) = Sblack;
ShowColorImage(S2,'0');

2. How to create a color mask rather than black color mask?
Sred = Sblack;
Sred(:,:,1)=255;
S2 = S;
S2(1:20,1:20,:) = Sred;
ShowColorImage(S2,'0');

3. How to create a transparent mask?
Sred = Sblack;
S2 = S;
S2(1:20,1:20,1) = 255;
ShowColorImage(S2,'0');

4. Finally, how to create an outline for the image?
linelength = 10;
Sblack = uint8(zeros(128+linelength*2,128+linelength*2,3));
S2 = Sblack;
S2((1+linelength):($-linelength),(1+linelength):($-linelength),:)=S;
ShowColorImage(S2,'0');
linelength = 10;
Sblack = uint8(zeros(128+linelength*2,128+linelength*2,3));
S2 = Sblack;
S2((1+linelength):($-linelength),(1+linelength):($-linelength),:)=S;
ShowColorImage(S2,'0');

Note: To run example in this article, please follow the installation of Scilab and toolboxes at previous post.
Tuesday, November 9, 2010
Back in Scilab Image Processing!
Some changes of the components I am going to use for my blog:
1. Scilab 5.3 beta-4 (Download this from http://www.scilab.org/)
2. SIVP Toolbox (After Installing Scilab, you could either install this via atom module manager or using command "atomsInstall(['SIVP','0.5.3']" , without the quote)
3. IPD Toolbox (install using atom module manager or using command "atomsInstall(['IPD','7.0'])", without the quote)
Thanks to the contribitors of the SIVP and IPD toolbox, you could find the name of the generous contribitors from the Module manager page.
There are some overlapping functions between these 2 toolboxes, but as they have their own advantages, I would just install and use them both!
A simple quick example:
Original Image from Scilab page.

--> S = imread('puffin.png');
--> imshow(S);

The above imshow function is the function from SIVP toolbox, which use the tk window for showing image.
--> ShowColorImage(S,'Puffin.png');

--------------------------------------------------------------
Reading an image in SCILAb
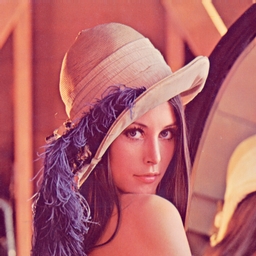 The imread command is used to read an image into SCILAB (Remember that SIVP must be loaded).
Z= imread('C:\Documents and Settings\Administrator\Desktop\images\lena.jpg');
will read the image into a matrix Z.
If the image is colour image,The size will be something like.
256. 256. 3.
here 256x256 is the size of the image. And the matrix will be composed of three 2D matrices each of dimension 256x256, representing the RGB values.

-----------------------------------------------------------------------
imwrite
Name
imwrite — Write image to fileCalling Sequence
ret=imwrite(im, filename)
Parameters
- im
imcan be an M-by-N (greyscale image) or M-by-N-by-3 (color image) matrix. Ifimis not of class uint8,imwritewill convert the datatype before writing usingim2uint8(im).- filename
- A string that specifies the name of the output file.
- ret
- Return value. If the image is successfully writed into a file,
retwill be 1.
i first installed
Scilab5.3.0 then
SIVP0.5.3
OpenCV2.2.0
No comments:
Post a Comment